How to alert for Pod Restart & OOMKilled in Kubernetes
This article introduces how to set up alerts for monitoring Kubernetes Pod restarts and more importantly, when the Pods are OOMKilled we can be notified.
Context
Recently, we noticed some containers’ restart counts were high, and found they were caused by OOMKill (the process is out of memory and the operating system kills it). No existing alerts are reporting the container restarts and OOMKills so far. Although some OOMs may not affect the SLIs of the applications, it may still cause some requests to be interrupted, more severely, when some of the Pods were down the capacity of the application will be under expected, it might cause cascading resource fatigue.
Data source
cadvisor & kube-state-metrics expose the k8s metrics, Prometheus and other metric collection system will scrape the metrics from them.
Here’s the list of cadvisor k8s metrics when using Prometheus.
Container Restart Metric
For monitoring the container restarts, kube-state-metrics exposes the metrics to Prometheus as
- kube_pod_container_status_restarts_total → Count
The number of container restarts per container.
We can use the increase of Pod container restart count in the last 1h to track the restarts.
1 | increase(kube_pod_container_status_restarts_total[1h]) |
OOMKilled Metric
When the containers were killed because of OOMKilled, the container’s exit reason will be populated as OOMKilled and meanwhile it will emit a gauge kube_pod_container_status_last_terminated_reason { reason: "OOMKilled", container: "some-container" } ,
- kube_pod_container_status_last_terminated_reason → Gauge
Describes the last reason the container was in the terminated state.
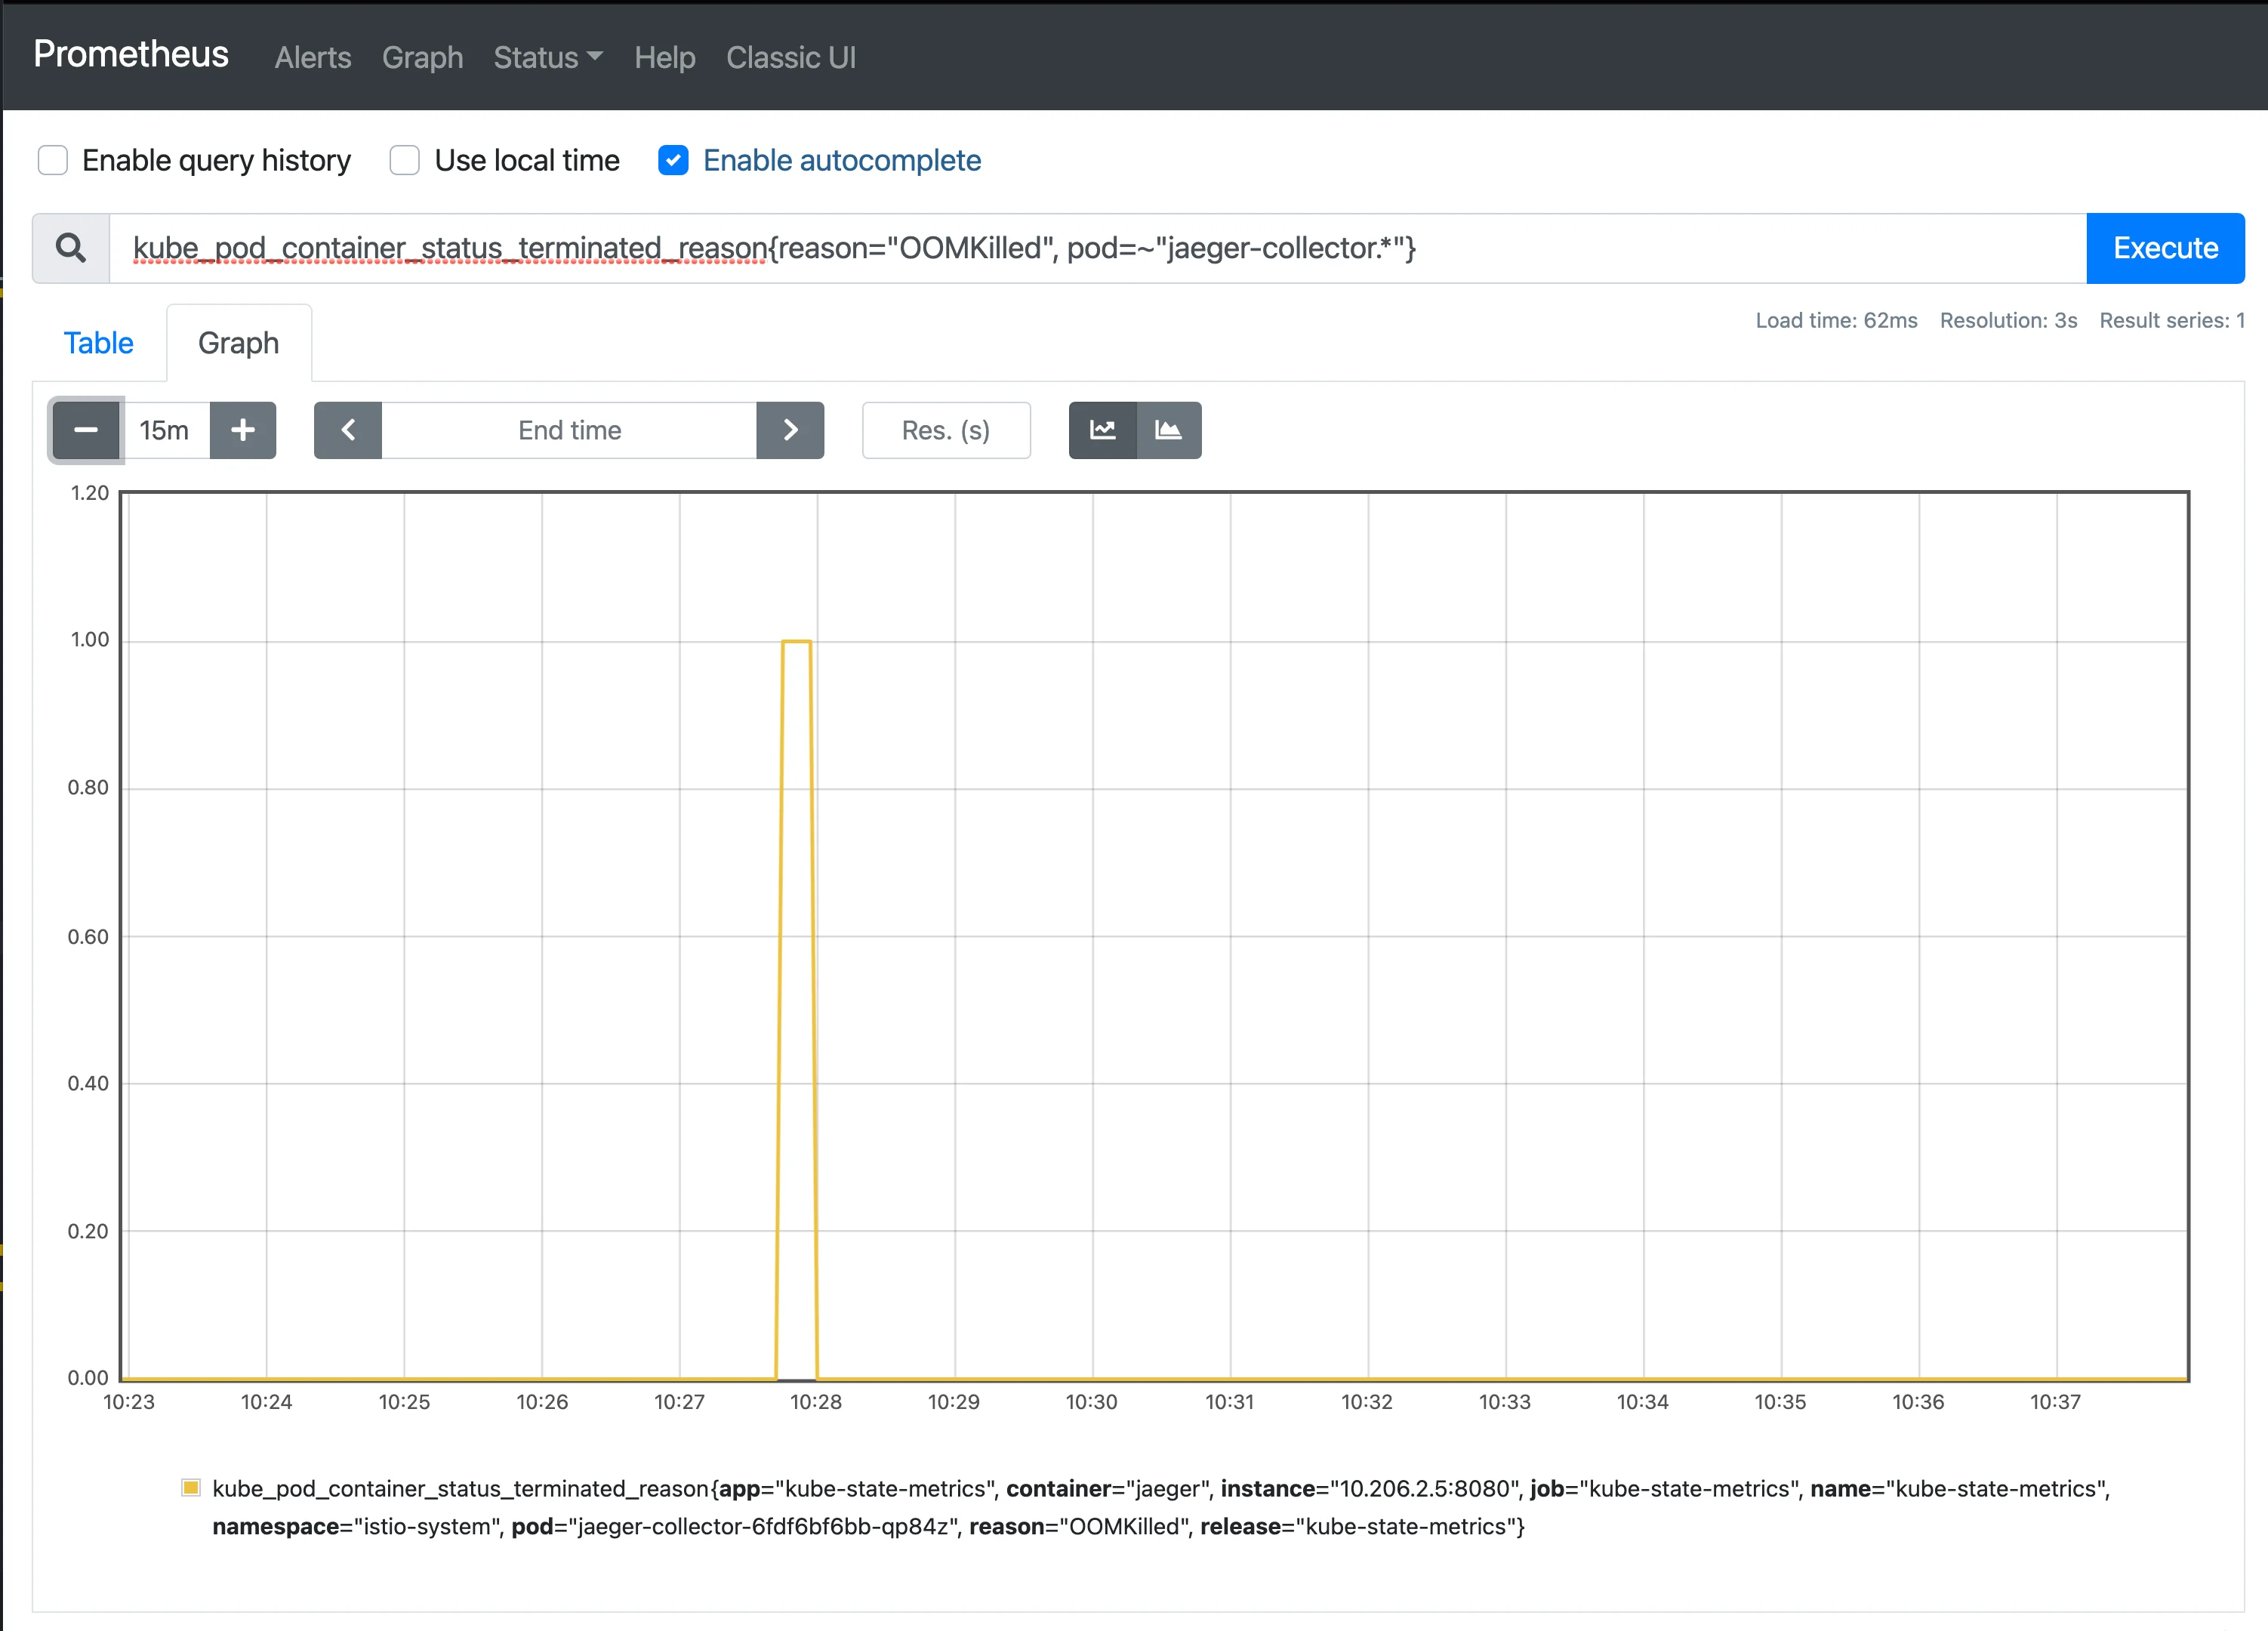
In Prometheus, we can use kube_pod_container_status_last_terminated_reason{reason="OOMKilled"} to filter the OOMKilled metrics and build the graph.
However, as Guide to OOMKill Alerting in Kubernetes Clusters said, this metric will not be emitted when the OOMKill comes from the child process instead of the main process, so a more reliable way is to listen to the Kubernetes OOMKill events and build metrics based on that.
Fortunately, cadvisor provides such container_oom_events_total which represents “Count of out of memory events observed for the container” after v0.39.1
- container_oom_events_total → counter
Describes the container’s OOM events.
cadvisor notices logs started with invoked oom-killer: from /dev/kmsg and emits the metric.
The kernel will oomkill the container when
- free memory is under the low limit
- memory fragment, when allocating memory greater than
and there is no contiguous memory available.
Alerting
We want to get notified when the service is below capacity or restarted unexpectedly so the team can start to find the root cause.
low-capacity alerts
This alert notifies when the capacity of your application is below the threshold. The threshold is related to the service and its total pod count. For example, if an application has 10 pods and 8 of them can hold the normal traffic, 80% can be an appropriate threshold. In another case, if the total pod count is low, the alert can be how many pods should be alive.
1 | # Use Prometheus as data source |
This alert can be highly critical when your service is critical and out of capacity.
Pod container restart rate too high
This alert triggers when your pod’s container restarts frequently. It can be critical when several pods restart at the same time so that not enough pods are handling the requests. This alert can be low urgent for the applications which have a proper retry mechanism and fault tolerance. When a request is interrupted by pod restart, it will be retried later. Otherwise, this can be critical to the application.
We can use the pod container restart count in the last 1h and set the alert when it exceeds the threshold.
1 | # prometheus |
For this alert, it can be low critical and sent to the development channel for the team on-call to check.
OOMEvents
OOMEvents is a useful metric for complementing the pod container restart alert, it’s clear and straightforward, currently we can get the OOMEvents from kube_pod_container_status_last_terminated_reason exposed by cadvisor.`
1 | # prometheus, fetch the counter of the containers OOM events. |
For this alert, it can be low critical and sent to the development channel for the team on-call to check.
Conclusion
By using these metrics you will have a better understanding of your k8s applications, a good idea will be to create a grafana template dashboard of these metrics, any team can fork this dashboard and build their own.