Generate monitoring dashboards & alertings using Grafana API
Grafana has been adopted as a common monitoring dashboard by more and more companies, in many cases, when operators need to create dashboard repeatedly they either choose to use template variables or create dashboards one by one. I think it’s very useful to leverage the Grafana API to generate the monitoring dashboards automatically from template.
My thought on dashboard automation
There’s a common use case, if you need to create a lot of similar dashboard (like system stats) for different services, the dashboard skeleton may always be the same, you can use template variables to make the difference. However, you can not create alertings on the graphs which use template variables, so in these situations you have to create graphs without variables.
So we can create a template dashboard first with variables in Grafana, then use scripts to read from the template and render them with variables we specify, finally call Grafana APIs to create/update dashboards.
Listen to what dashboards we need to create/update, collect metadata first.
For example, if it’s for server stats, we need to get the server info from cloud provider or other infrastructure.Trigger the change to the dashboard
- Create the template of dashboard with template variables, it’s okay, we’ll replace the template later.
- Render the template with the metadata we collected.
- Add the graphs using CRUD APIs.
Metadata
Metadata is what you need to generate dashboards, basically it contains:
- How many dashboards you want to create?
- What are each dashboard’s variables?
If you use public cloud providers, cloud APIs can be used otherwise you have your own infrastructure management APIs.
Template dashboard
Grafana Variables is a good functionality for monitor a great number of servers or application, defining the template dashboard with variables is good for rendering because you can not only view the effect on the template but also the variable is easy to replace for the format is $VARIABLE or [[VARIABLE]], string replacement is enough for this.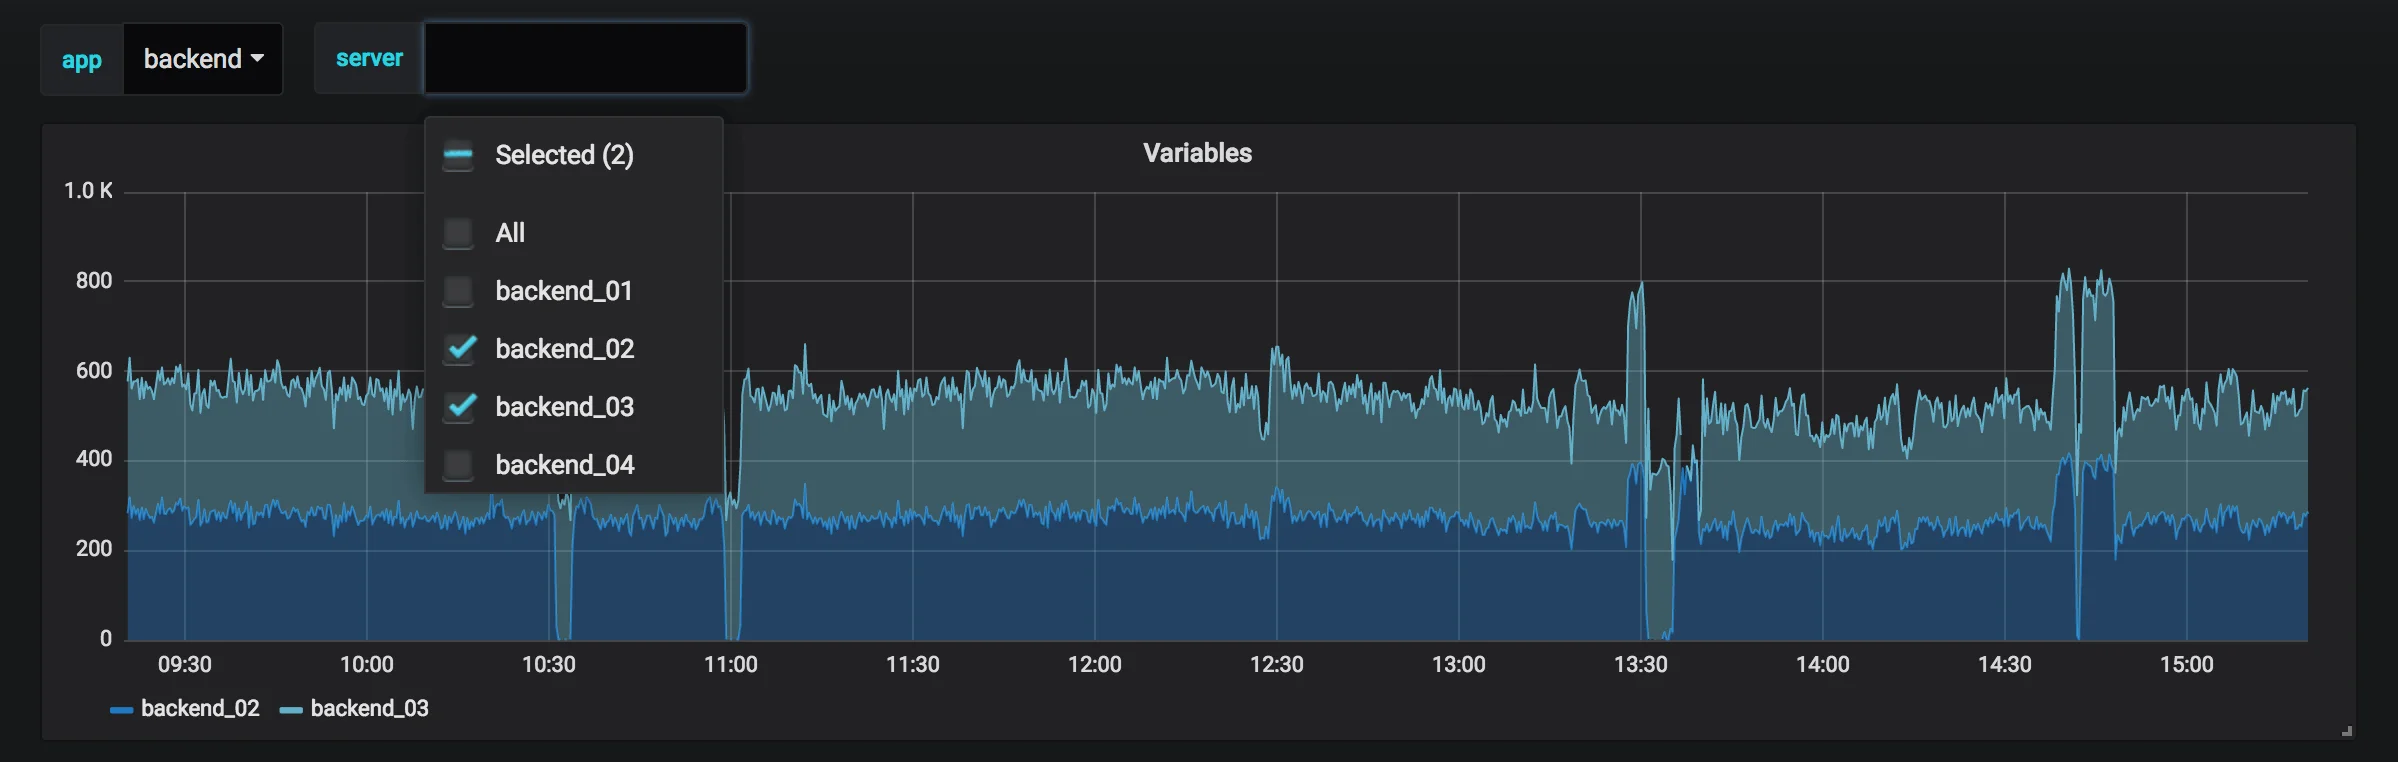
Grafana dashboard CRUD API
Grafana provides enough HTTP APIs to do this, once you create the template dashboard it already has the graphs and alertings, so Grafana dashboard API is enough for most cases.
For authentication, you can create a service account for automating the dashboards and use API token to call APIs.
The automation scripts can maintain a relationship between the dashboard UID and dashboard name and you can also do the change comparison before updating the dashboards.
Delete the dashboards when some of them are deprecated.
Run your automation
It’s okay to run automation scripts as cronjobs.
Reference
- Grafana dashboard API
- Grafana alerting API is only used to get alerts, if you need to modify the alerts using dashboard API
- Grafana API token
- Grafana SDK
- Grafana dashboard reference